
Build a report
The builder sections are Filters, Group by, Measure, Chart, and Sort. The preview updates shortly after a change. The previous numbers stay visible while the next ones load.
Building a report. Captions are on the picture. There is no voiceover and no music.
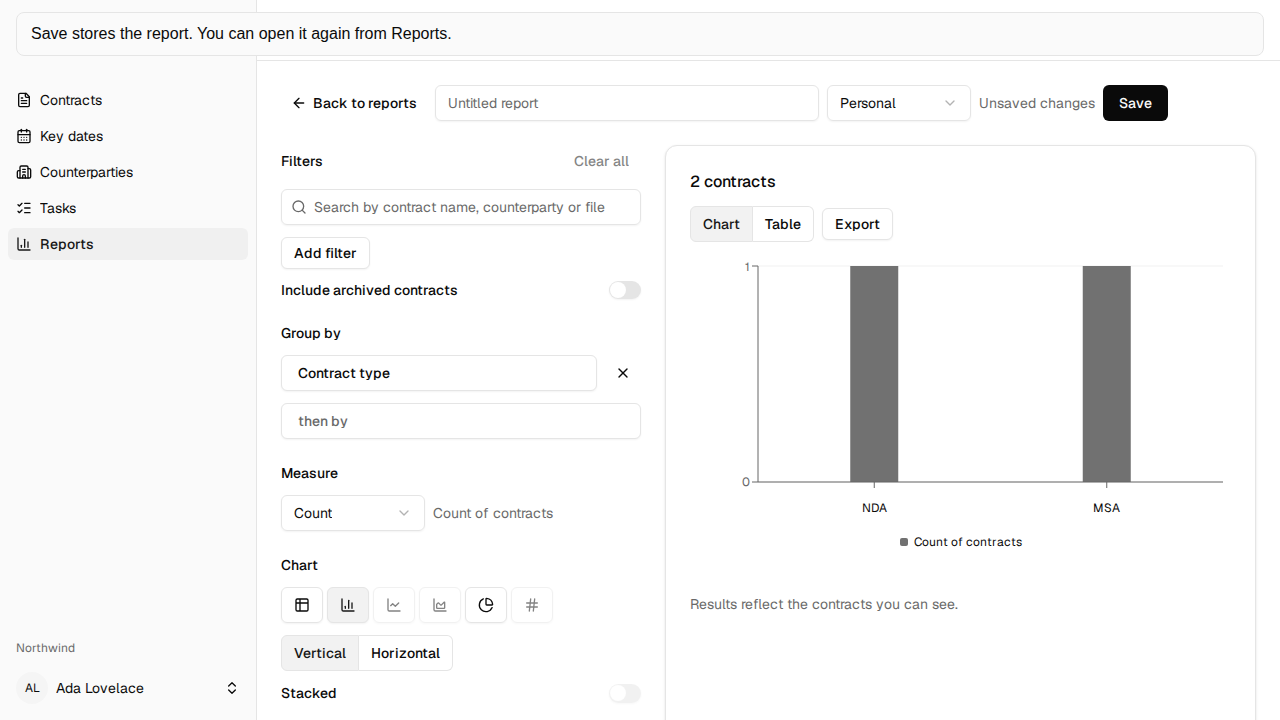
Transcript: Group by Contract type. The bar chart counts contracts you can see. Save stores the report. You can open it again from Reports. The report is saved under the name you entered.
Filters
Section titled “Filters”Filters use the same bar as the contracts grid. Done closes a filter value. Include archived contracts is one switch. Show archived is not also a filter here. Clear all stays in the Filters heading.
Group by
Section titled “Group by”Group by is one field. A second level says then by. A field already used is left out. Remove a level with the × beside it. A date can use a bucket (day, week, month, quarter, or year) and a window (any time, last or next months, this year, or last year). Month is the usual bucket. Last months includes today. A window such as the next 12 months stays current. A blank or spaces-only text value is the empty group. A missing value is its own group, such as “No owner” or “No expiry date”, and you can open it.
A contract with two owners, teams, counterparties, or multi-select values is counted once under each. The total counts each contract once, so the groups can add up to more than the total. The page says “A contract can appear in more than one group.”
Measure
Section titled “Measure”Choose Count, or Sum, Average, Minimum, or Maximum of a number or a currency. The control names the result beside it, such as Count of contracts or Sum of Contract value. A currency total is split by currency and is never added across currencies. You can group a currency total by one other field, not by that same currency.
Table, Bar, Line, Area, Pie, or KPI. A type that does not fit stays visible and can be focused. The reason is available to keyboard and screen-reader users. Bar can be vertical or horizontal. Stacking needs two groups. Pie can be a donut. Line and area need a date grouping.
The output is one card with the contract count, a Chart or Table view, and Export for CSV and, for a chart, PNG. The table columns are the group fields and the measure, with the numbers on the right. A chart shows the first 200 groups. Pie charts show at most 12 slices and fold the rest into Other. Other is not a button. The table lists every group.
A chart bar, slice, or point is a button named with its group and value. A ring shows the focused mark. Enter, Space, or a click opens Contracts with the filters from that group. Enter on the table’s group does the same.
Save and export
Section titled “Save and export”The title starts as Untitled report. Type a name, choose Personal or Workspace, then Save. Saving without a name asks for one. Save as copy is only there once the report is saved.
Export, then CSV, saves every group, up to 2,000. More than 2,000 groups asks you to add a filter or choose a coarser bucket. PNG saves the chart. Table view shows the same numbers without the chart.
A saved field that is no longer available is named on the report and left out of the numbers. Saving stores the report without that part, the notice goes away, and opening the report again does not show it.